Introduction
As developers, we are aware that even minor changes to our code can have a significant impact on the performance of our website or product. A few lines of code can make all the difference between a website that loads quickly and one that takes forever.
It is extremely vital in the field of web development to produce performant solutions that require the least resources while providing a smooth experience for the user. Let me define profiling for you before we get started.
"Profiling is a way of measuring execution time at the method level as well as collecting run-time information such as consumption of memory, processor, threads, and the number of classes loaded over the course of the application's operation."
What is Chrome Profiler?
Chrome Profiler is a part of Chrome DevTools, a set of web developer tools built directly into the Google Chrome browser. It provides a rich set of features to analyze runtime performance and find performance bottlenecks in our web application developer.chrome.com
The powers of Chrome Profiler
The Chrome Profiler is equipped with a variety of thoughtfully crafted features. Let's explore a few of them:
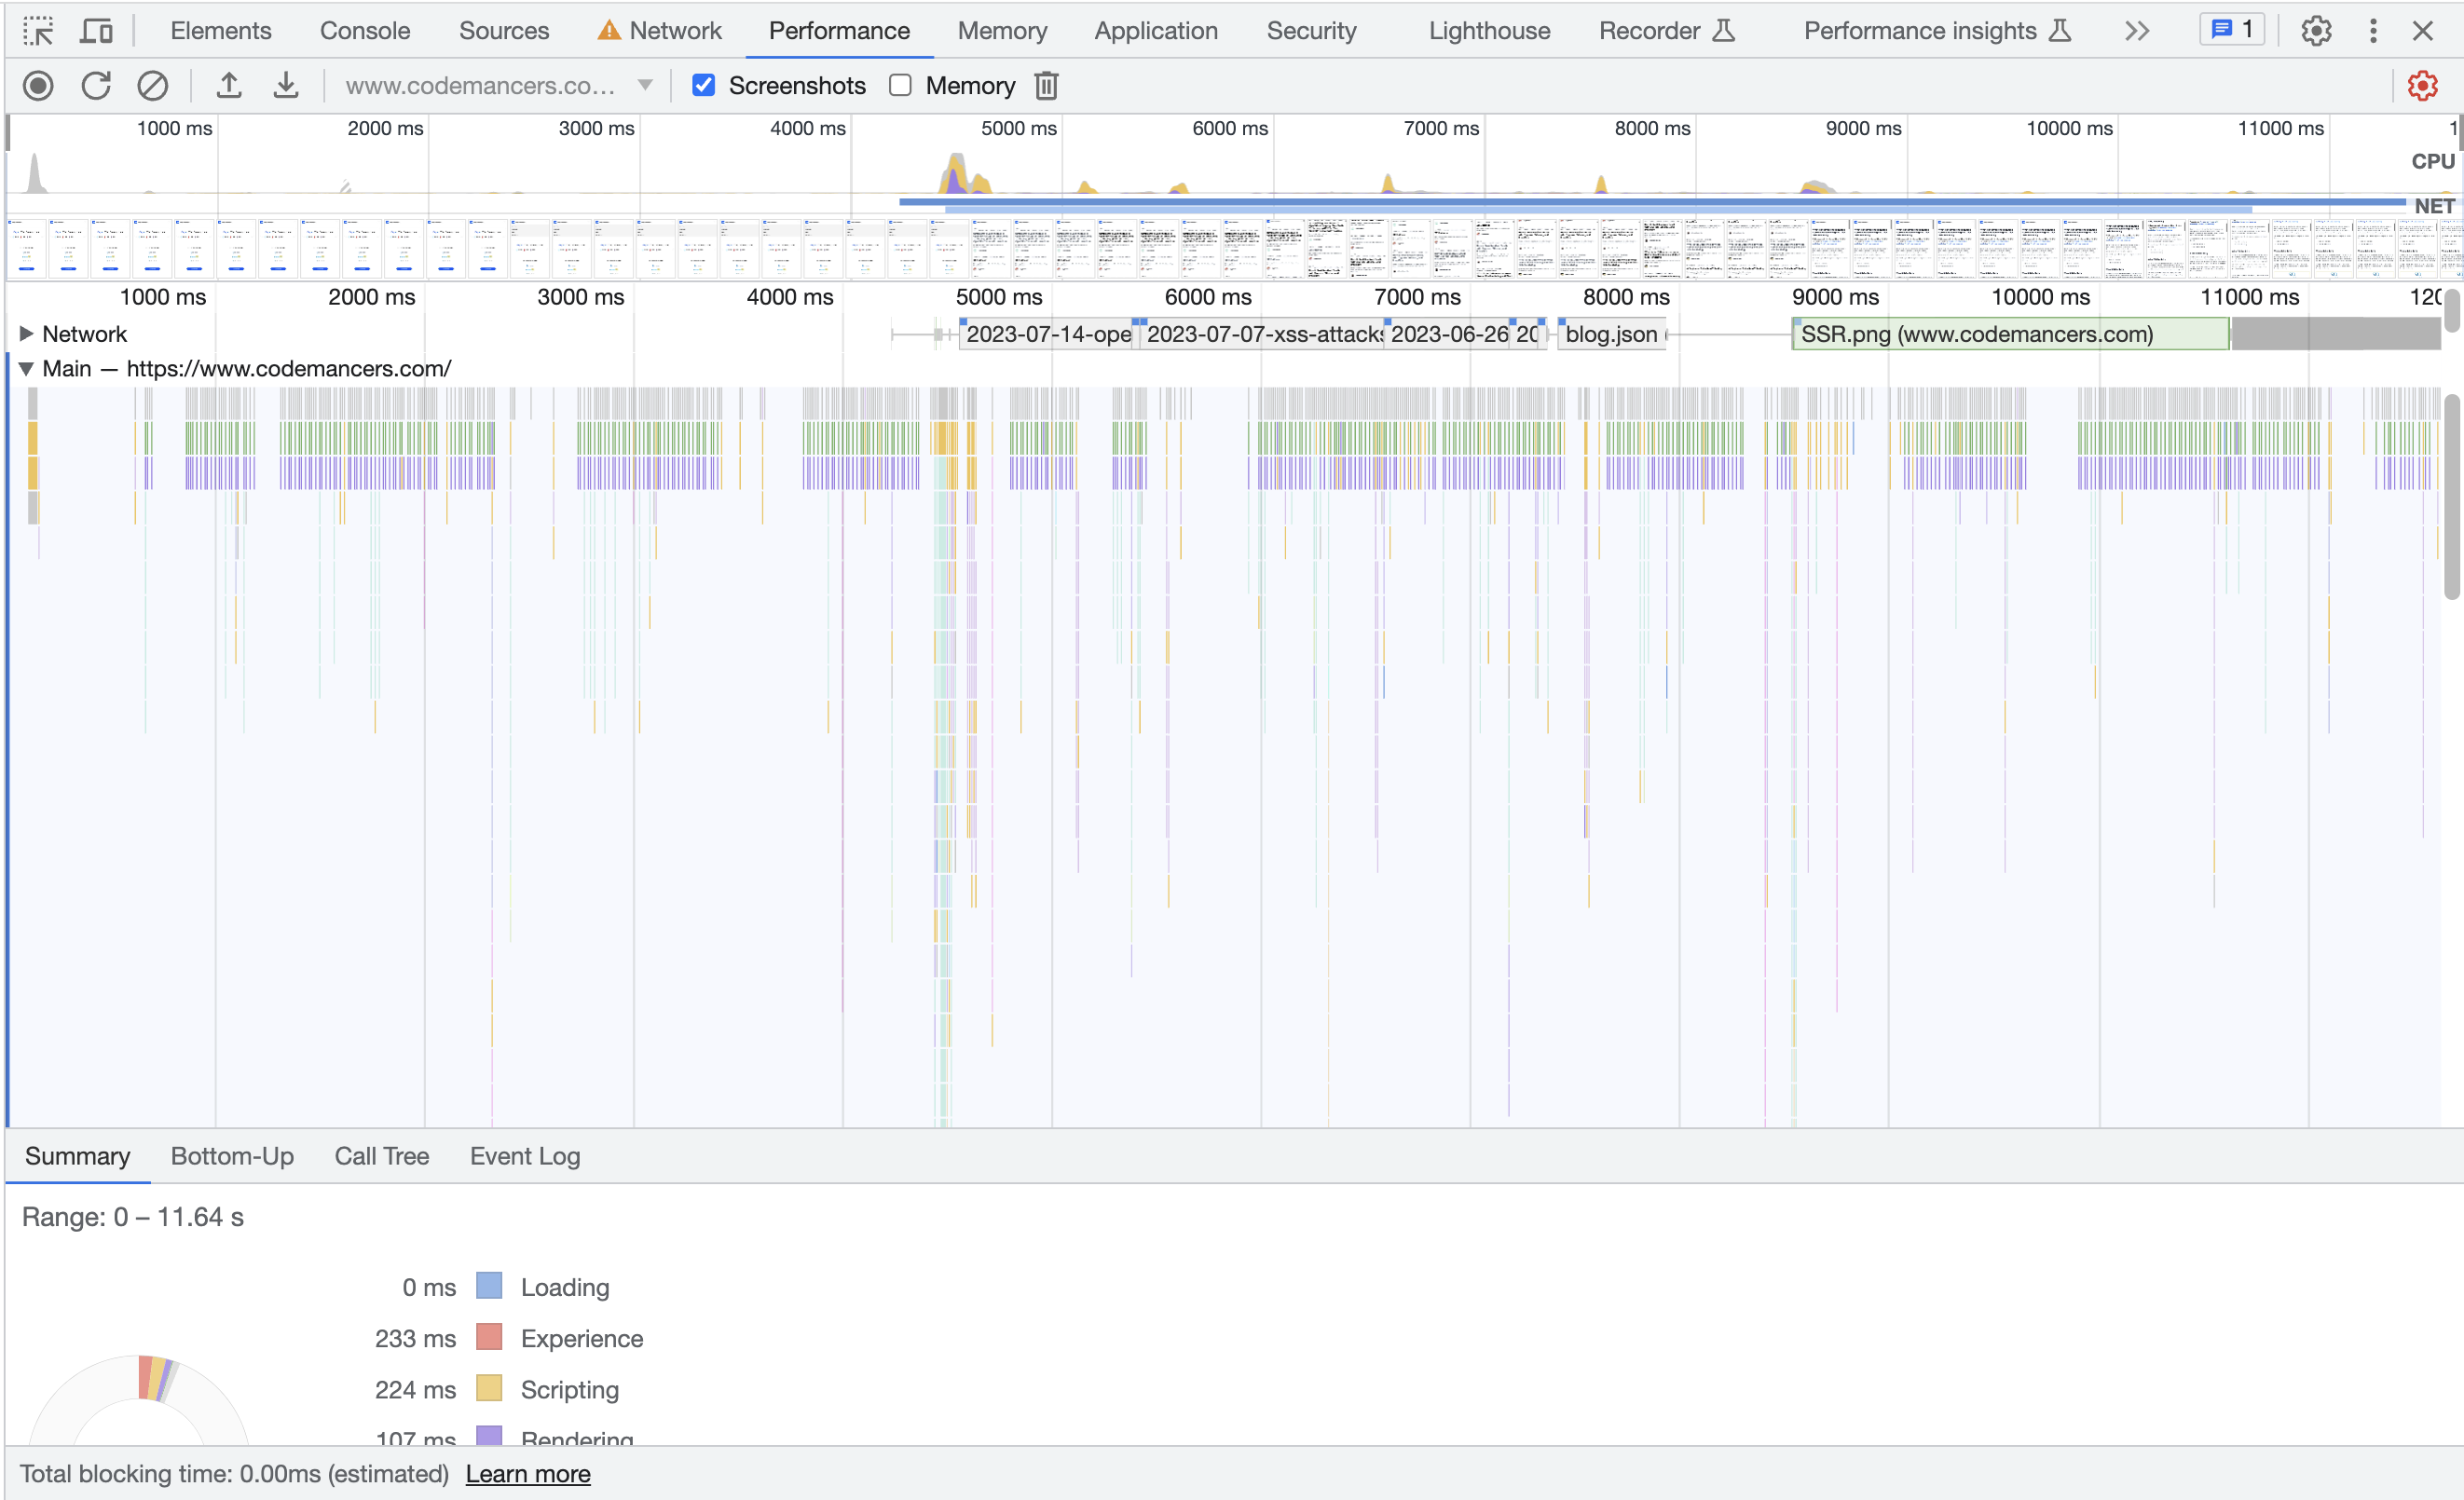
Timeline View: In Chrome Profiler, the timeline view simplifies the exploration process. It visually shows numerous events that occur during the page's lifecycle, which can aid in determining when and where performance issues occur.
CPU and Memory Profiling: Another notable feature is the ability to monitor CPU use and memory consumption over time. It becomes a useful tool for identifying functions that are creating excessive CPU burdens or probable memory leaks.
Frame Rendering: One of Chrome Profiler's most important capabilities is frame rendering, which is required for smooth animations and responsive layouts. We can examine how long each frame takes to produce in order to identify potential issues, such as dropped frames.
User Interactions: By recording and mapping user interactions with performance data, one can observe how particular behaviors affect program responsiveness. This is useful for improving the overall user experience.
JavaScript Profiling: Chrome Profiler can capture and show JavaScript function call stacks, which can help identify functions that consume the majority of execution time. This becomes critical when looking for ways to improve our JavaScript codebase.
How to Use Chrome Profiler Effectively
It's simple to get started using Chrome Profiler.
-
Launch Google Chrome. Open DevTools by pressing
Command+Option+I(Mac) orControl+Shift+I(Windows, Linux). Navigate to the Performance tab in DevTools. -
Capturing Performance. To monitor the performance of our website. Press the record button. Now, engage with the website by scrolling, clicking on buttons, or performing other tasks that we want to evaluate. When our desired interaction has ended, click the Stop button. This will provide a performance recording for us to review and analyze.
- Advancing the Analysis. The performance recording will display a flame chart, illustrating the call stack data over time. Each bar denotes a function call, and the longer the bar represents, the more time it took for the function to execute. By clicking any specific function call, we can view its details in the Summary tab, which can assist in identifying performance bottlenecks.
- Optimization and Iteration. Once we've identified performance bottlenecks, we can make the necessary optimizations to our code and then run the profiler again to see the impact. Iteratively refine our code and retest to achieve the best possible performance.
Conclusion
The Chrome Profiler is a useful tool for optimizing the performance of our website. It allows us to witness events, monitor how much memory and CPU our machine is using, understand how the screen is rendered, observe how users interact, and track how our JavaScript code performs. All of these capabilities assist developers in identifying issues in their code that slow things down.
Alas! There's more to learn. To fully utilize the Chrome Profiler, we should become familiar with flame graphs and extensive function lists. These show us even more about how our code works in the browser. So remember to keep trying new things and using the power of the Chrome Profiler.