The page load time is an important aspect of the website user experience. The faster the page loads, the happier the users will be. There are various reasons for slow web page loads. Performance monitoring and testing of API endpoints is one way of understanding how websites and services behave when hundreds or thousands of users access them.
What is Percentile ?
Percentile is the common metric in case of Performance testing. If a backend service's 95 percentile is 30ms, it means 95% of requests have response time of less than 30ms.
How to calculate Percentile ?
Here is the response time for one of the endpoint:
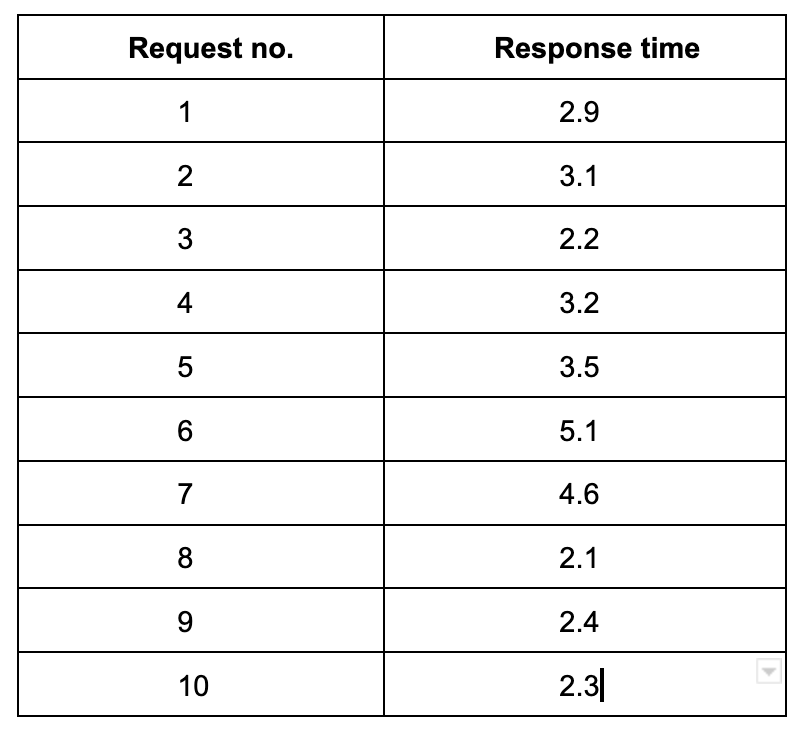
Sort the data based on response times
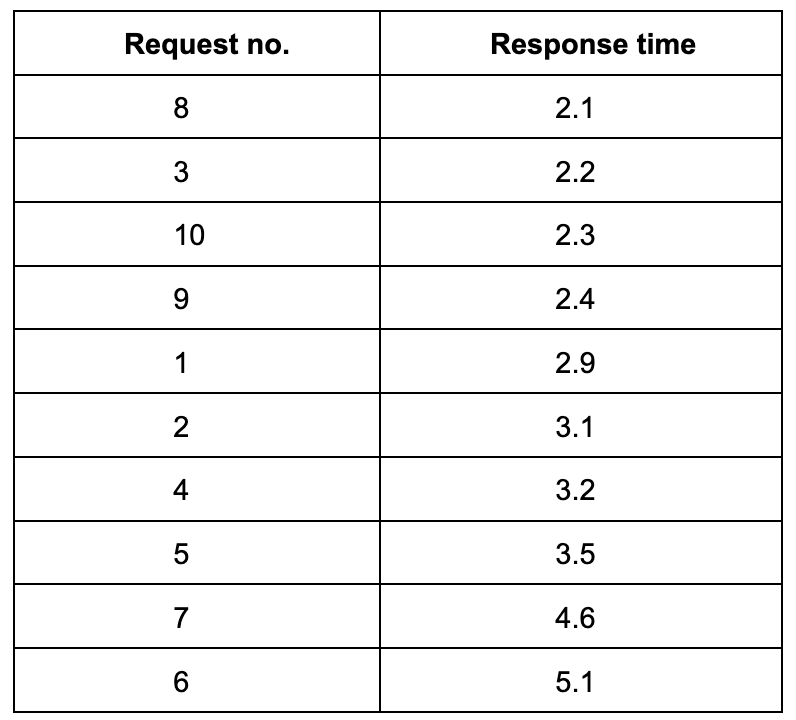
Apply the formula
index = (n * (90/100)) where n = Number of requests
index = (10 * 0.9)
index = 9
In the above table, 9th index value is 4.6
So, 90 percentile for the above set of response times is 4.6
Here I am calculating 90 percentile for fewer data where as in real world applications this number can be in thousands or millions.
What about average response time ?
Average response time is also one of the metrics of performance monitoring and as the name says it is the average value of the response times. This can occasionally be misleading if fewer requests have very high response times.
Consider the above set of records and if the response times were as mentioned below instead of 5.1 and 4.6
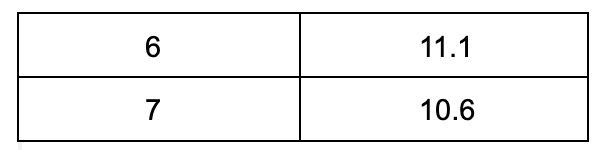
Average response time is 4.34s even though majority of the response time hovers between 2 and 3. Thus with average response time metric, fewer requests can bring difference in how the graph looks