When moving from a monolith to a microservice architecture for addressing scaling challenges, a key point to consider is monitoring. In a microservices-based architecture, applications are deployed onto distributed, dynamic and transient containers. This makes monitoring essential for preventing the next service disruption, and when required, figuring out the cause of a disruption or service outage. For a cloud based architecture like an AWS cloud, a managed solution like Amazon CloudWatch provides a view into the state of a microservice architecture, but such managed solutions do come with a set of limitations despite the benefits they offer. That's where Prometheus, along with Grafana, fits in. In this blog post, we cover the why and what of monitoring. Then using Prometheus and Grafana we build a solution to address the common monitoring requirements of a microservices-based architecture.
Monitoring
For designing an insightful monitoring solution, it is important to keep track of what and why we are monitoring any particular service.
Why Monitor?
The initial reason for monitoring a service would be for keeping track of when it faces a disruption or breaks. This is certainly a key reason as alerting is an essential part of monitoring. However, with a well designed monitoring solution, additional capabilities open up:
- Dashboards: Useful and actionable insights, at a glance. Being able to quickly create new dashboards when needed, as well as pick and choose components from existing dashboards.
- Long-term Trends: Keeping track of an application's performance over time for infrastructure capacity planning.
- Root Cause Analysis: Diagnosing any service disruption or issue requires data, provided by the monitoring solution.
What to Monitor?
Monitoring a microservice-based architecture is not limited to a Kubernetes Cluster or application in the cluster. Instead, there are four main components to monitor in general:
- Hosts: Either nodes in a cluster like Kubernetes or individual servers on which the application is dependant.
- Containers: The containers and pods in the cluster.
- Databases: Any database or datastore the applications use.
- Applications: The applications themselves.
Monitoring Tools
After planning out the monitoring requirements of the microservice architecture, the next part is setting up the tools to do the monitoring. With the overwhelming list of options available, deciding which one to go with can be a challenge.
CloudWatch (Managed Monitoring Tool)
When starting off with a monitoring solution, a managed one like Amazon CloudWatch is a potential option. In the case of CloudWatch, initial setup is quick and integrates easily with all AWS provided services for monitoring an AWS cloud. However, exclusively depending on CloudWatch can soon lead to a couple problems:
- Expensive: Cost grows rapidly with every additional metric being monitored.
- Limited querying capabilities: Running complex queries is either not possible or prohibitively expensive.
- Limited external integrations: When an architecture has a number of components outside AWS, getting metrics from the non-AWS components into CloudWatch is tedious and unreliable unless AWS has built an integration for that particular component.
- Not Kubernetes native: CloudWatch is built for monitoring an AWS cloud and not specifically a Kubernetes cluster, which can be an issue when a complex Kubernetes cluster is involved.
- Eventual consistency nature: Data on CloudWatch can be minutes behind as CloudWatch might report un-coverged values
- Difficult to enforce least privilege: Sharing dashboards with developers and users without granting access to the AWS account can be cumbersome and limited in flexibility
Prometheus
Prometheus is open-source and built specifically for monitoring cloud native apps deployed on dynamic cloud environments. As a popular CNCF supported projects, it has a lot of community support and integrations with other applications. As a monitoring tool build for cloud native apps, it can natively scrape metrics and integrate with the Kubernetes API Server. The flexible labels-based time series database can be queried with the powerful PromQL language for generating alerts and dashboards. In short, Prometheus does the following:
- Real-time metrics collection and storage
- Pull-based metric collection model with a configurable scraping interval
- Querying with PromQL
- Alerting with Alertmanager
- Huge selection of official and community built integrations/exporters
Notably missing in the above list is dashboards, which is where Grafana fits in to complement Prometheus.
Along with dashboards, there are a few other application monitoring features that Prometheus does not handle as well as the alternatives:
- Log/Event Collection with an ELK stack
- Anomaly Detection with InsightFinder or Anodot
- Error Tracking with Sentry
Grafana
Grafana is an open-source metric visualization tool that supports multiple data sources, Prometheus being one of the most popularly used data sources. The analytics and visualizations provided by Grafana help make sense of all the monitoring data scraped by Prometheus. The transformations available in Grafana make it easy to manipulate data in Prometheus, such as converting non-time-series data into tables. The intuitive editor and annotations allow for creating interactive, searchable and insightful dashboards quickly, either from scratch or by importing one of the many thousands of available community-built dashboards.
Prometheus & Grafana Setup
The kube-prometheus-stack Helm chart maintained by the Prometheus community can be used to easily deploy a Prometheus monitoring stack onto a Kubernetes cluster.
Once the stack is up, exporters can be setup depending on what needs to be monitored, a couple examples are:
- Node Metrics Exporter
- Blackbox Exporter
- PostgreSQL Exporter
- CloudWatch Exporter Many of the popular exporters have Helm charts already available for use, made by the Prometheus community.
With the data scraped and stored in Prometheus, dashboards on Grafana are provisioned either with the Grafana community built dashboards or custom-built dashboard JSONs that can be imported.
After all these three are setup, a monitoring solution is ready:
- The exporters expose metrics from the component they are monitoring
- Prometheus scrapes the exporters and stores the metric data in a time-series database. Both the data retention and scraping interval can be configured.
- Grafana queries Prometheus with PromQL and visualizes the metrics
The above setup is available on this Git repo
What does it looks like?
With the deployment, provisioning and configuration done, metrics will be scraped from exporters, alerts will fire on the configured receivers and dashboards will be visible on Grafana. Using these Grafana dashboards and the alerts setup in Prometheus, this monitoring solution can serve multiple purposes, including:
- Cluster Telemetry to indicate the saturation and utilization of resources by the cluster.
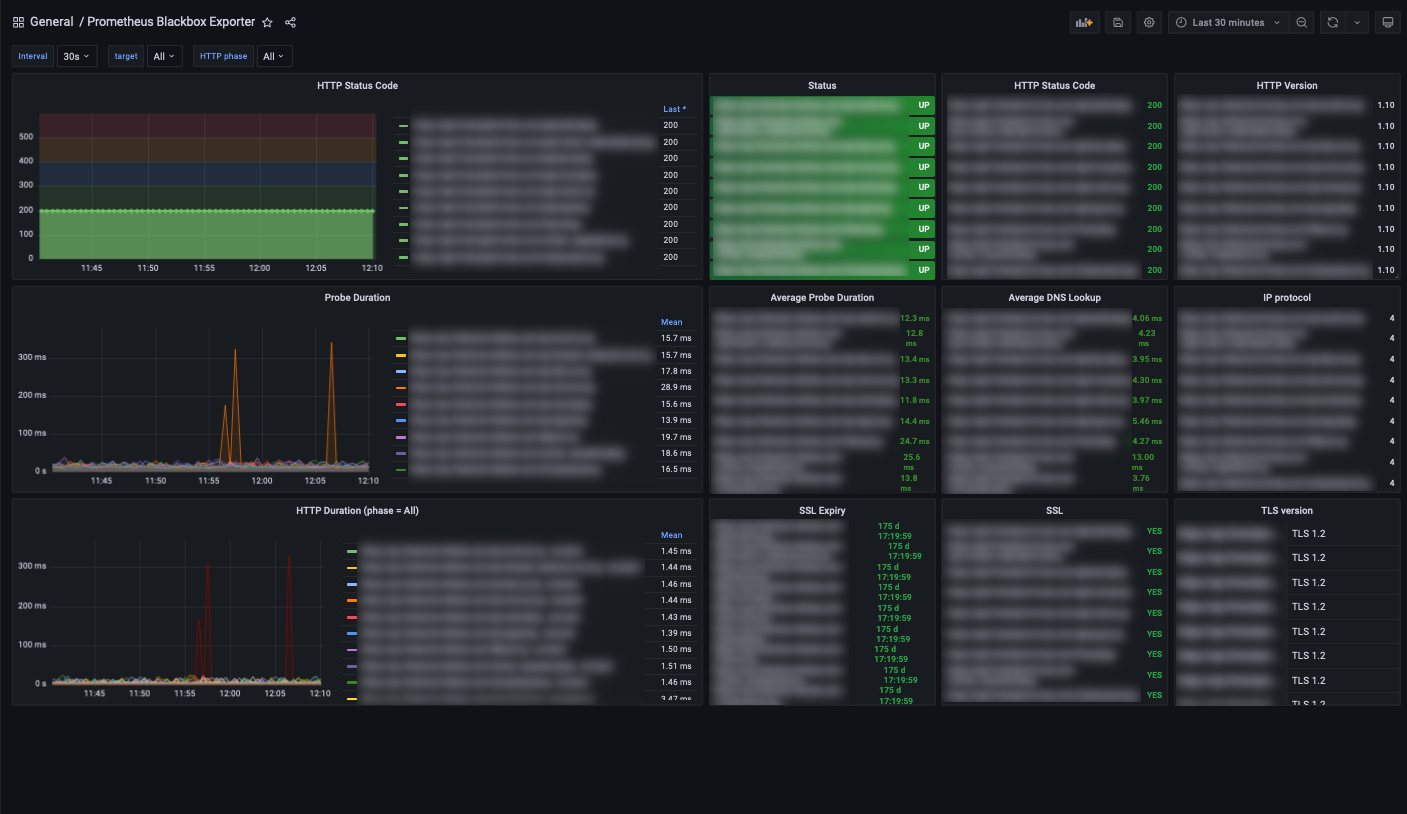
- Uptime Monitoring for alerting on downtime, service disruption or longer than expected response time of a particular service.
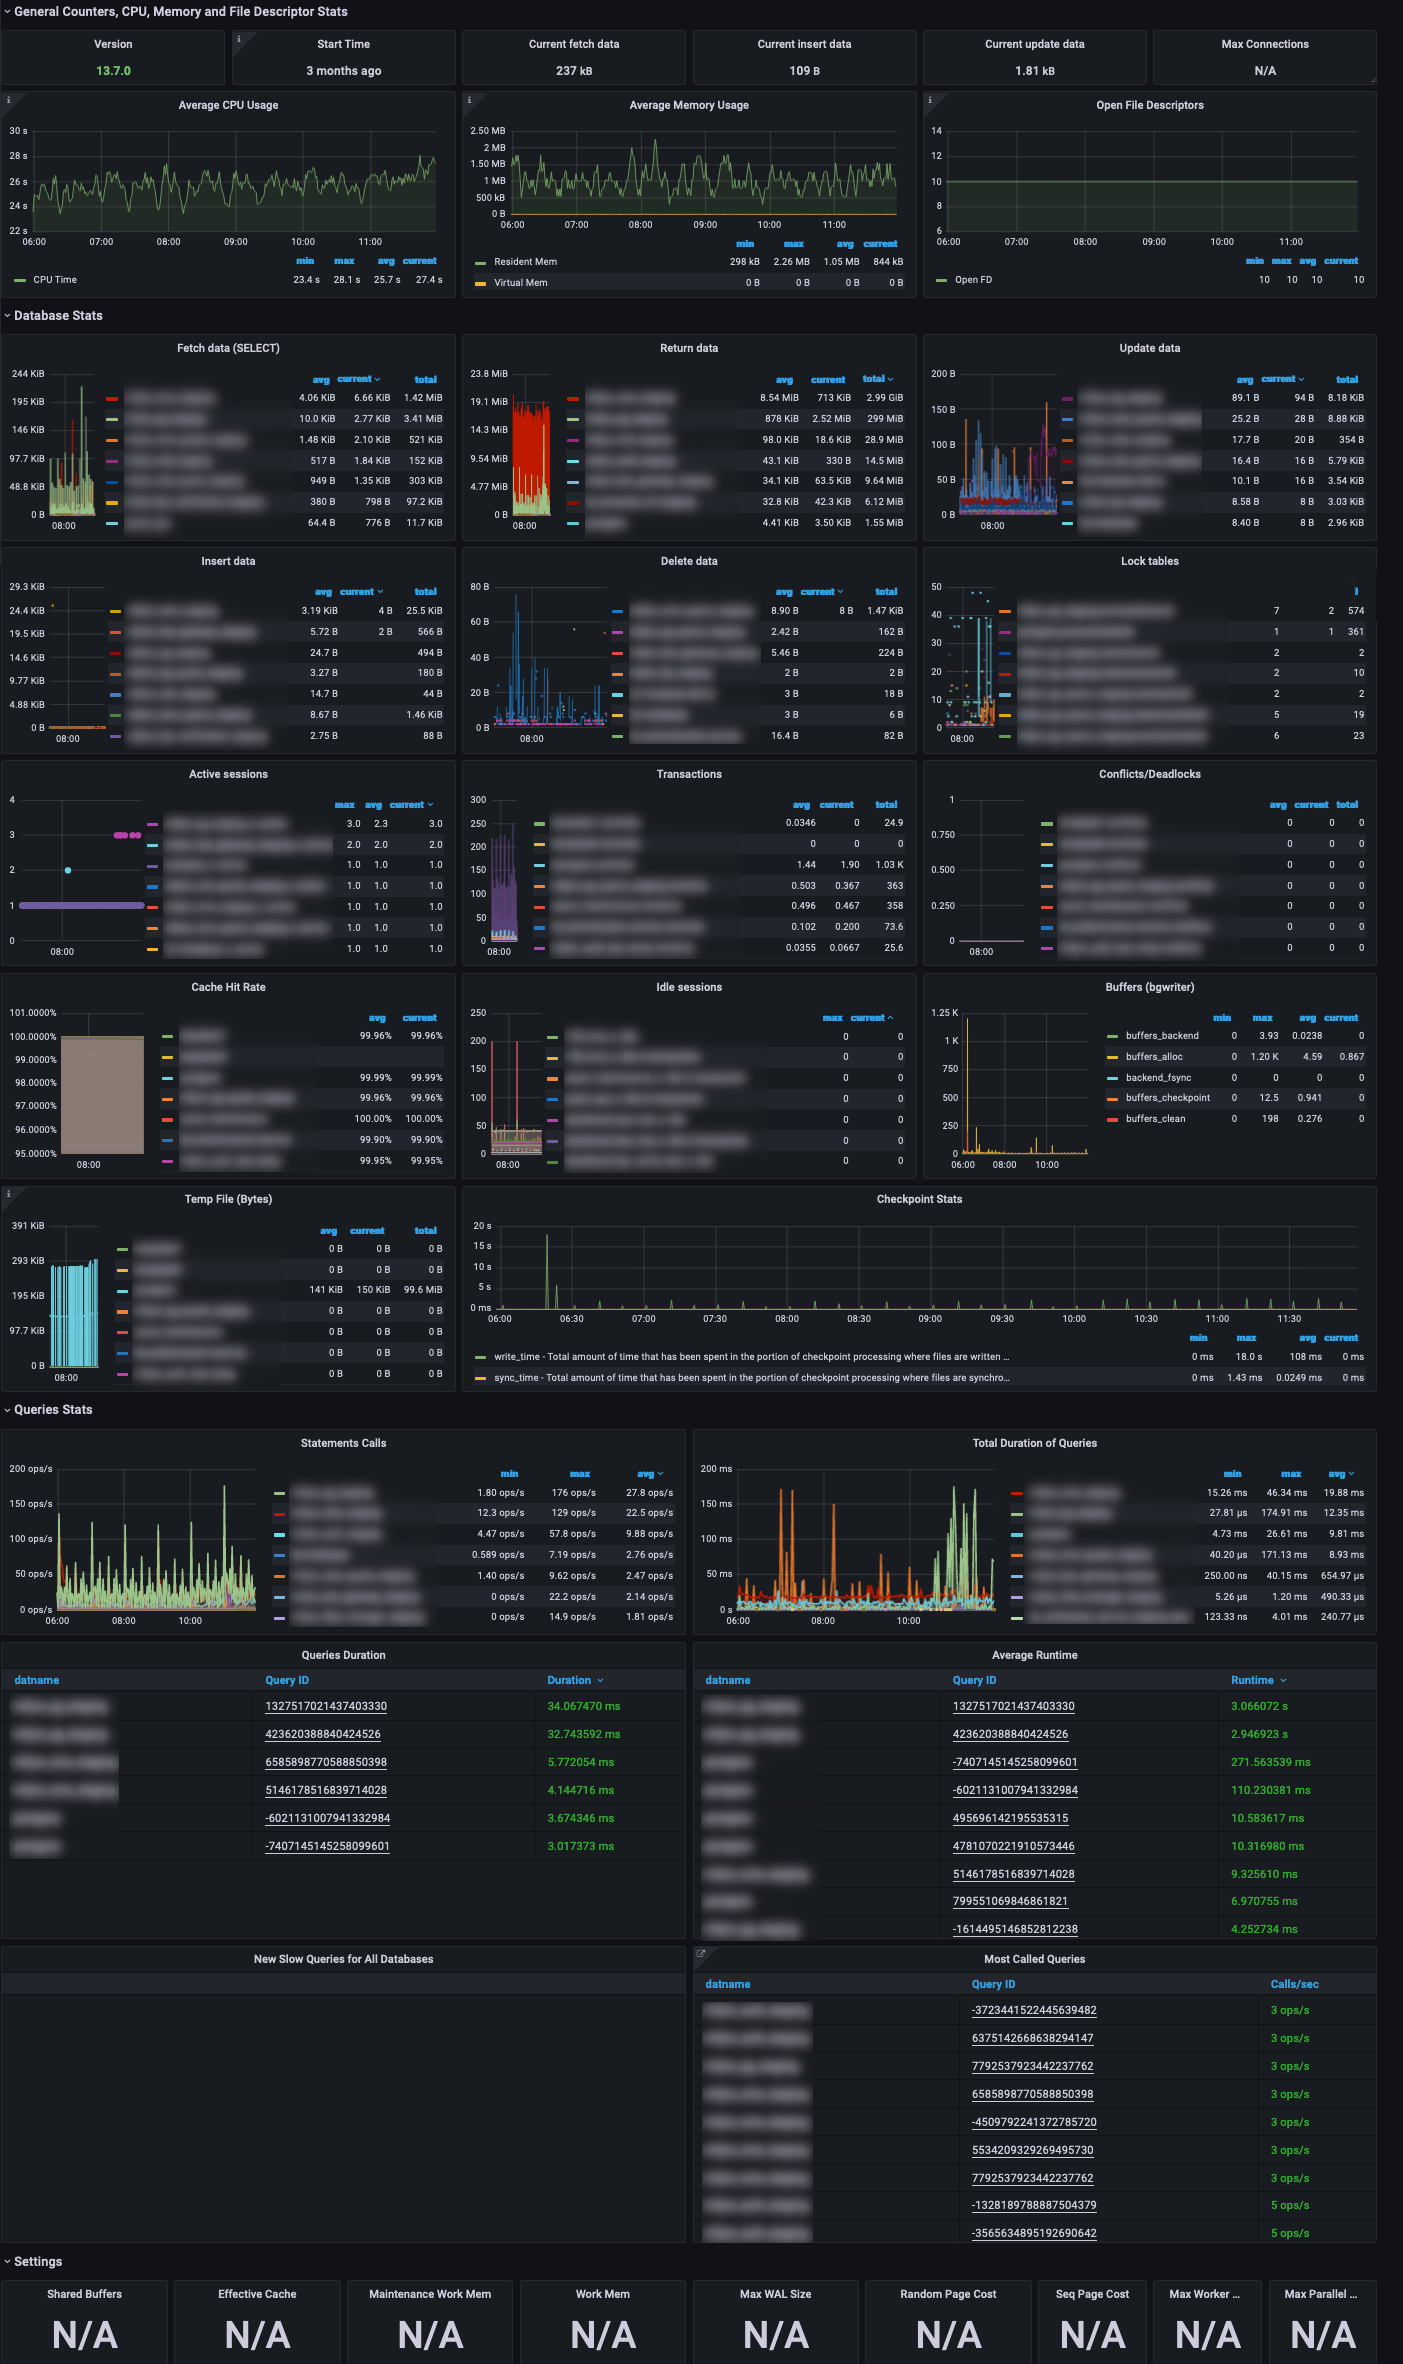
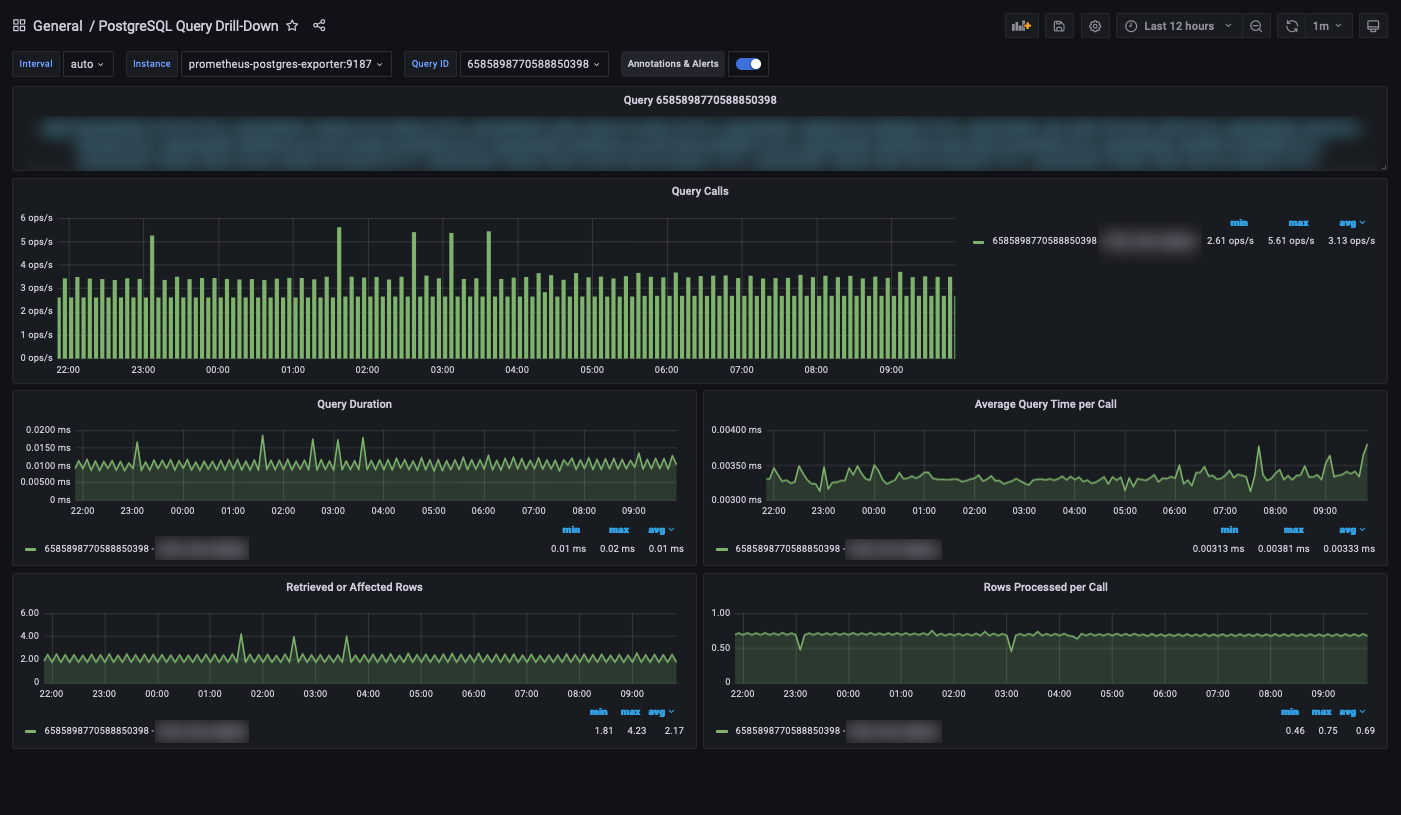
- Postgres Performance Tracking that can identify slow queries responsible for delayed response or high CPU usage from the database.
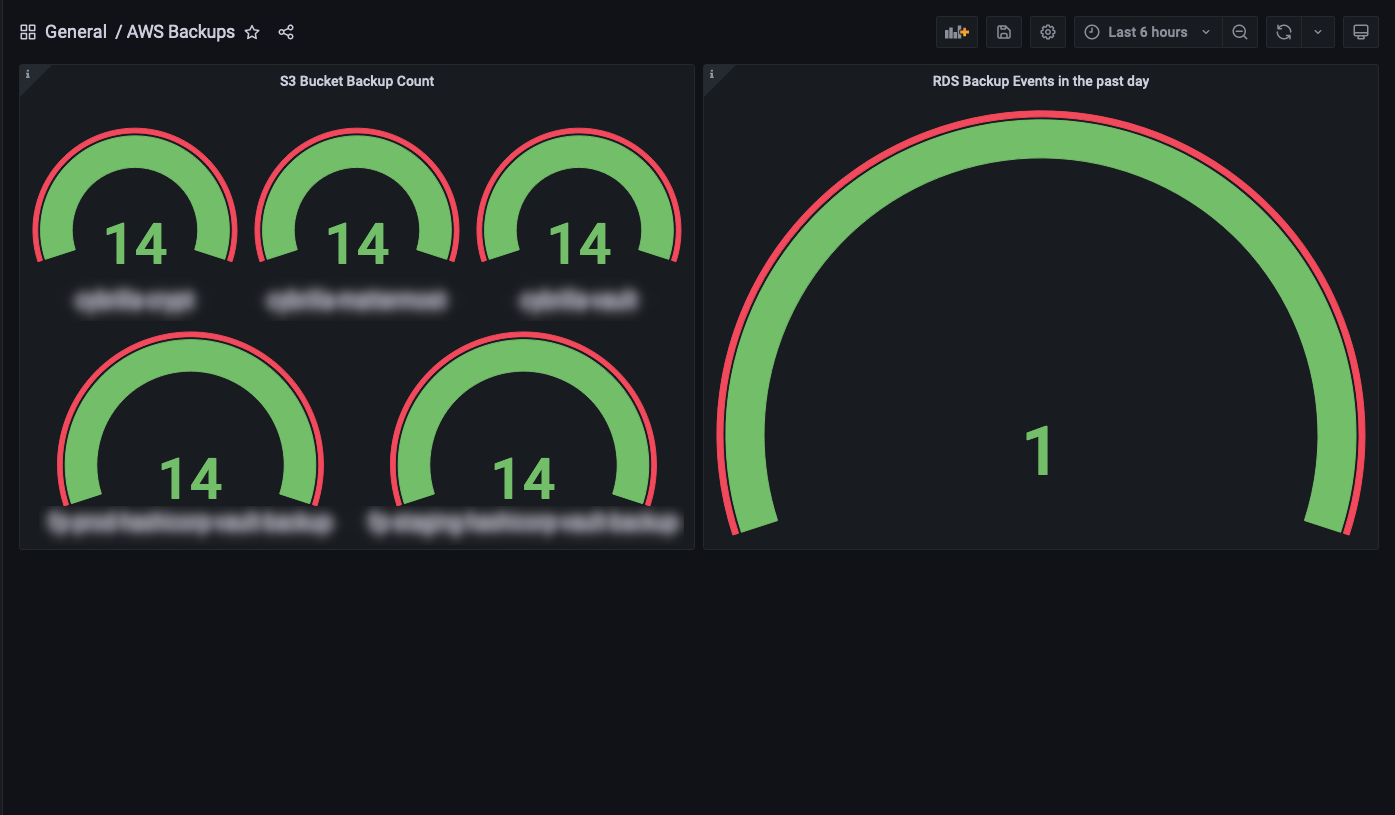
- Backup Monitoring to ensure the necessary backups are being taken and retained for expected duration.
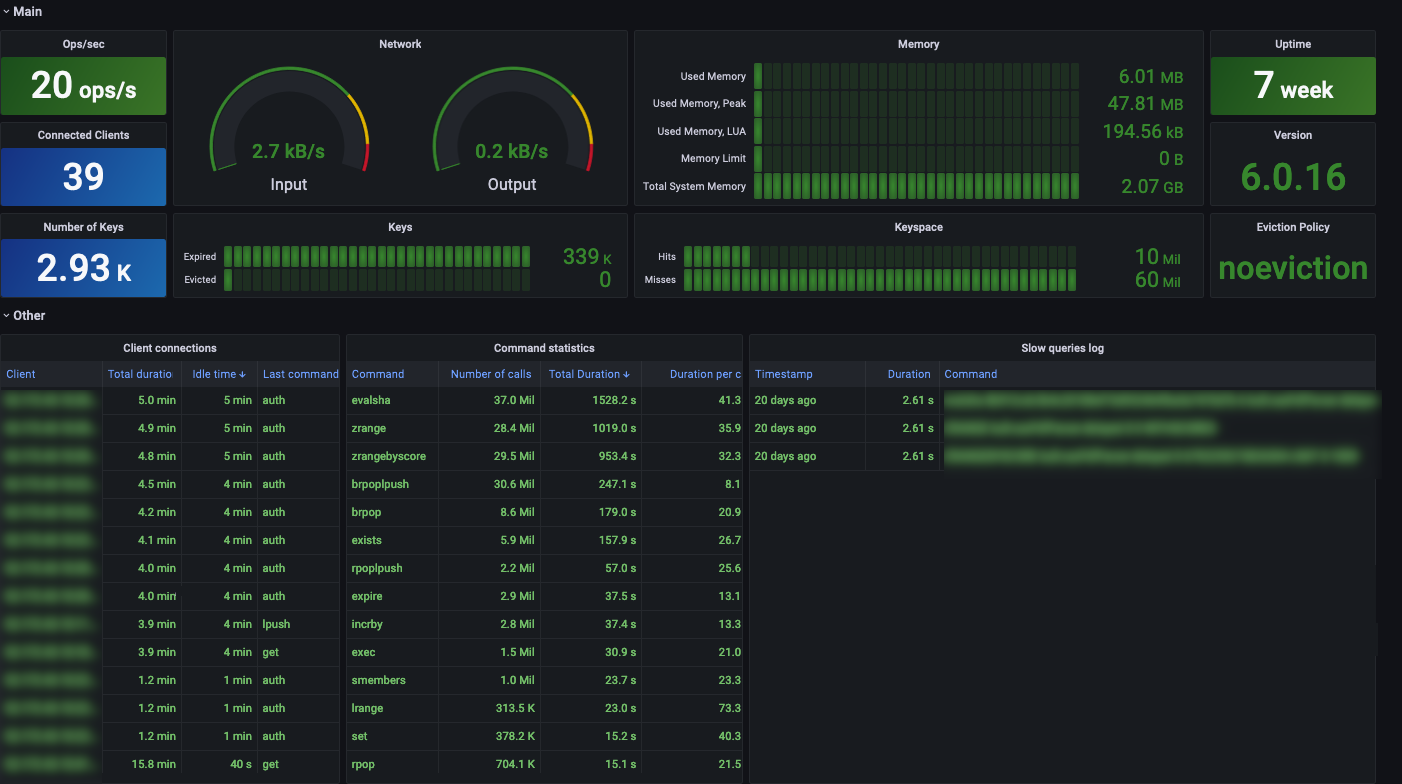
The below screenshots show the dashboards that are provisioned by the setup present in the Git repo, mentioned in the previous section.
Blackbox Dashboard
PostgreSQL Dashboard
PostgreSQL Query Drill-Down
Redis Dashboard
CloudWatch Dashboards
What next?
The Prometheus and Grafana monitoring solution built in this blog will go a long way, but the capabilities of Prometheus extend ever further:
- Build a Highly Available Prometheus setup, using Thanos or Cortex
- Add the power of SQL and traces to Prometheus, using Promscale
- Visualize events from Sentry, using the Grafana + Sentry integration
And with the huge community and CNCF support, Prometheus gets better and better!
