Elixir Remote Debugging
by Emil Soman,
In Elixir, it's possible to connect nodes together to form a cluster in which
all the nodes are visible to each other. This feature
can be used to inspect and debug production apps running on remote nodes.
Let's see how we can connect to an Elixir node running inside a docker container
remotely from a local iex shell and use Erlang's debugger tool to set
breakpoints and debug the code running in the remote node.
Remote node
Let's say we have a host machine running on IP 1.2.3.4. Our docker container
will be running on this host and the command that runs inside the container is:
bash
iex --cookie secret --name remote@1.2.3.4 \
    --erl '-kernel inet_dist_listen_min 9000'  \
    --erl '-kernel inet_dist_listen_max 9000' \
    -S mix
This will start the app inside iex shell and also does the following things:
- Sets
secretas the cookie which is used when connecting nodes together. - Sets the node name as
remote@1.2.3.4where1.2.3.4is the IP address used to connect to the node. - Makes the node listen on port
9000. - This also starts the
epmdprocess if it's not running already.
epmd
epmd (Erlang Port Mapper Daemon) is Erlang's name server which runs by default on the port 4369. If a local
node wants to connect to the remote node remote@1.2.3.4, it first talks to
the epmd process running on 1.2.3.4 and gets the port where the node remote
is running which is 9000. Now the local node can directly talk to the remote
node using this port.
Docker port mappings
The local node needs to access ports 4369 and 9000 on the remote IP
that it tries to connect to, which is 1.2.3.4 in our example.
The following command starts the docker container and also maps the ports on the host machine:
bash
docker run -p 4369:4369 -p 9000:9000 my_elixir_image
Local node
This is the command we'll use to connect to the remote node from our local iex:
bash
iex --cookie secret --name local@127.0.0.1 \
    -e "Node.connect(:'remote@1.2.3.4')" \
    -S mix run --no-start
This will start the iex shell and compile our app and all dependencies,
but won't start our app. This is done because we only want the application
running on the remote node to activate the breakpoints. If we have the same
app that uses the same modules running locally, the breakpoints may get triggered
from the local app. So we disable the app from running locally using mix run --no-start.
When the iex shell starts, it will connect to the remote node by executing the
expression Node.connect(:'remote@1.2.3.4'). You can see that the cookie that's
used here is same as the cookie that was used when we started the remote node.
Once the iex shell is up and running locally, you can use Node.list() to
verify that the remote node is visible inside our local shell.
iex(local@127.0.0.1)1> Node.list()
[:"remote@1.2.3.4"]
Debugger
Now that our nodes are connected, we can start the Erlang debugger GUI locally and start debugging.
iex(local@127.0.0.1)2> :debugger.start()
You should be able to see the debugger UI which looks like this:
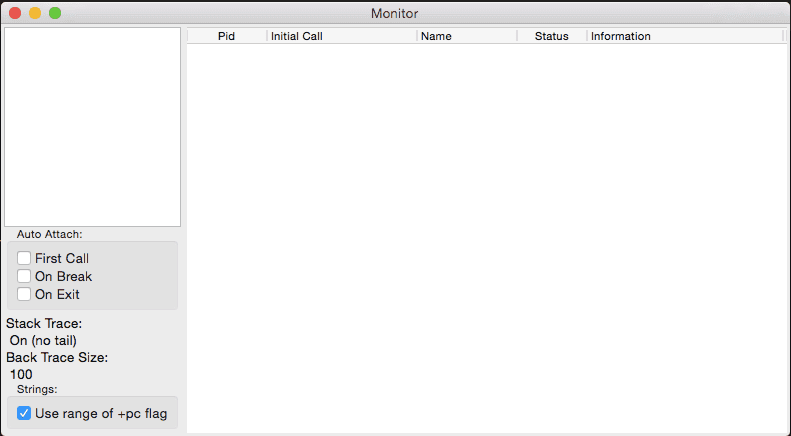
Now, we'll run the following in the local shell to interpret the module that we want to debug:
iex(local@127.0.0.1)3> :int.ni(RemoteDebuggerTest)
{:module, RemoteDebuggerTest}
Interpreting a module makes the debugger aware of the source code for the module and allows the debugger to add breakpoints in the module and attach to processes running the code inside this module. Once the module is interpreted, the debugger will list all the processes executing the code in the interpreted module:
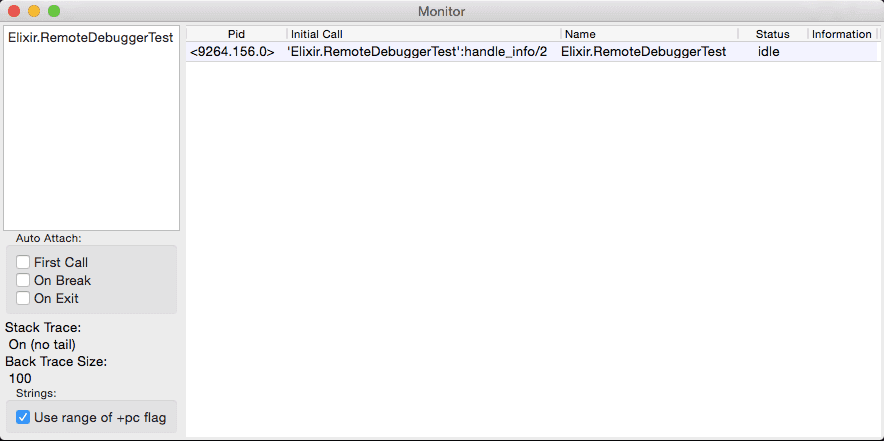
The example program that is currently being debugged is in idle state most of the time because it doesn't do much other than sending a message to itself and sleeping.
Now, let's open our module by double clicking on the module name on the left panel of the monitor window which is already open and add a breakpoint by double-clicking an executable line.
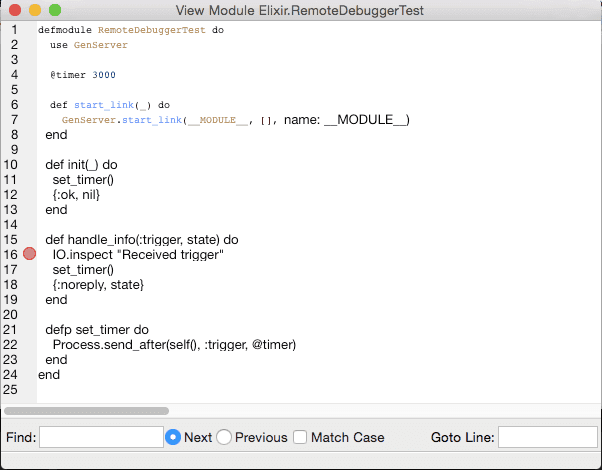
Now when this line of code gets executed, we can see in the monitor window
that the status of the process changes to break.
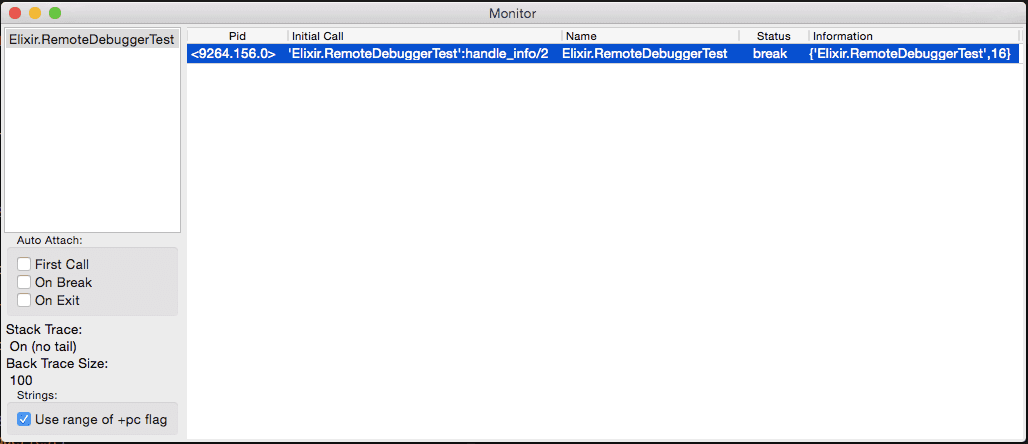
Now we can attach to this process by double-clicking on it and then we can interact with the debugged process:
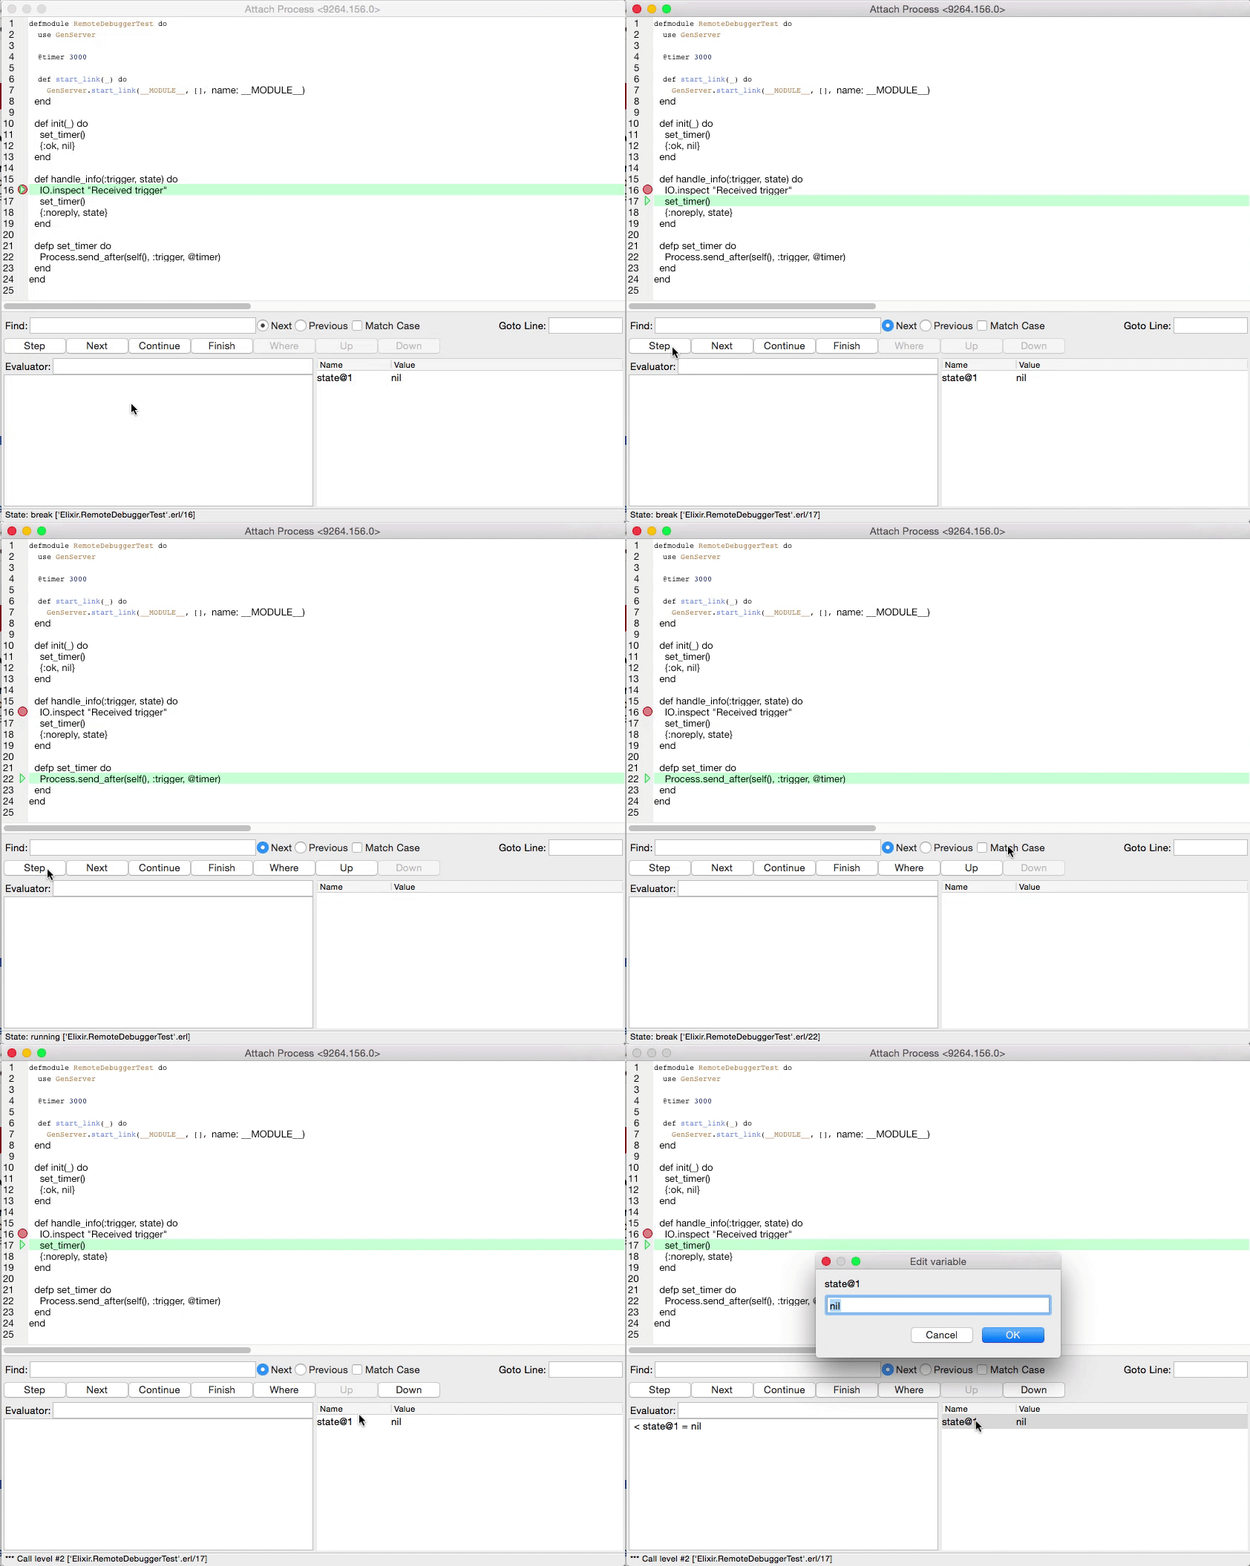
Read the user manual here to learn how to use the many features in the debugger tool.
Hope you found this useful, and do follow us on twitter
@codemancershq
to get updates with more Elixir content.