How to Read a Flame Graph in Chrome DevTools
by Syed Sibtain, System Analyst
Introduction
In part one of this series, we covered how to record and inspect performance traces in Chrome DevTools. In this part, we will go deeper into the flame chart itself.
A note on terminology: Chrome DevTools calls this visualization a flame chart. You may see it referred to as a flame graph elsewhere — the terms are often used interchangeably, though technically a flame graph aggregates sampled data while Chrome's flame chart shows a timeline of individual call frames.
If you've ever opened the Performance panel and felt unsure about where to focus, this guide is for you. By the end, we will know how to read bars correctly, distinguish parent and child calls, and find expensive functions faster.
Where to Find the Flame Chart
- Open DevTools (
Command+Option+Ion Mac orControl+Shift+Ion Windows/Linux). - Go to the Performance tab.
- Click Record, perform an interaction, and click Stop.
- In the result view, focus on Main under the flame chart area.
At this point, every rectangle we see is a function execution frame over time.
What the Bars Mean in a Flame Chart
The flame chart is not just random colors. It encodes execution in a strict way:
- X-axis (left to right): Time progression.
- Bar start position: When that function started.
- Bar width: How long that function took (total/inclusive time).
- Y-axis (top to bottom): Call stack depth.
- Top frames: Parent calls.
- Lower frames: Child calls made by the parent.
Chrome’s flame chart is inverted compared to classic flame graphs: callers are on top here, whereas in many other tools the root sits at the bottom. If you’ve used those before, this layout can feel backwards at first.
One important point:
- A wide parent bar is not always slow because of its own work.
- The parent might be wide because its children did expensive work.
This is why we always inspect both:
- Self Time (work inside the selected frame itself)
- Total Time (self + all descendants)
Annotated Screenshot: Flame Chart Orientation
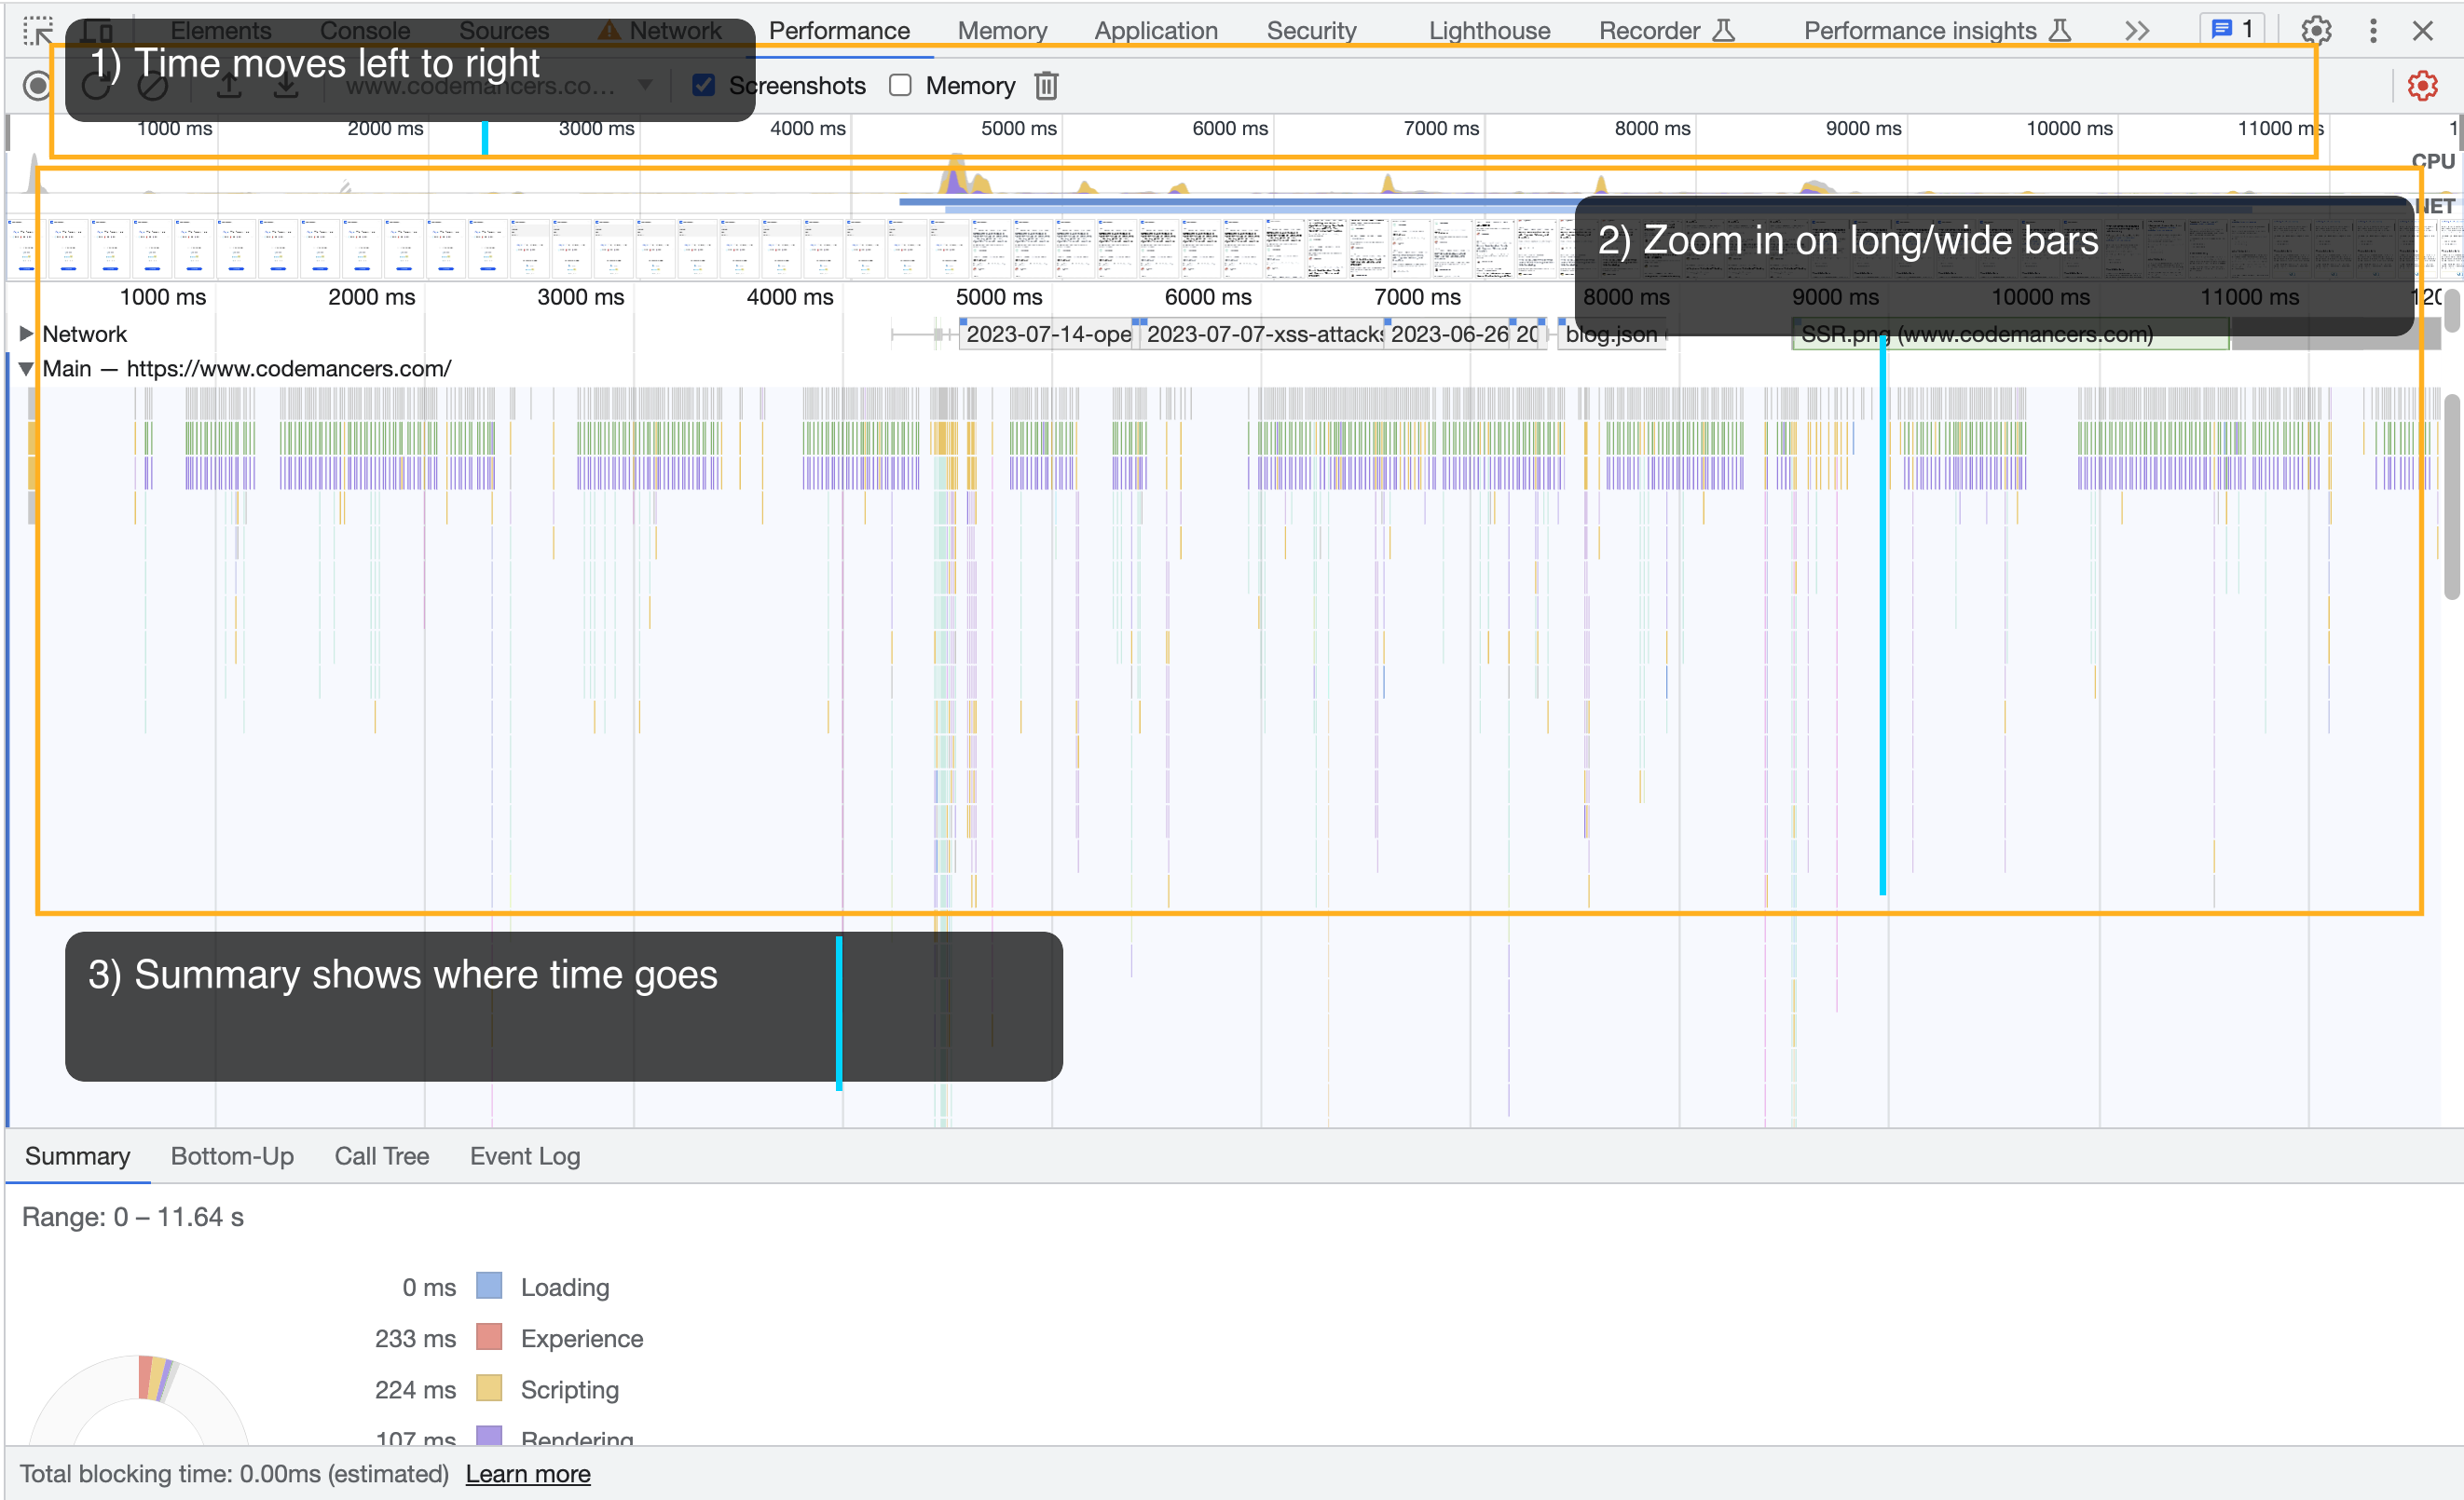
How to read this screenshot:
- 1) Time moves left to right so we can map events to a user action.
- 2) Zoom in on long or wide bars to inspect expensive regions.
- 3) Summary panel helps confirm where total time is going (e.g. loading, scripting, rendering, painting).
Parent vs Child Calls (The Most Common Confusion)
If we select a frame in DevTools:
- The frame above it is the caller (parent).
- Frames below are callees (children).
- Parent
Total Timeincludes child execution. - Parent
Self Timeexcludes child execution.
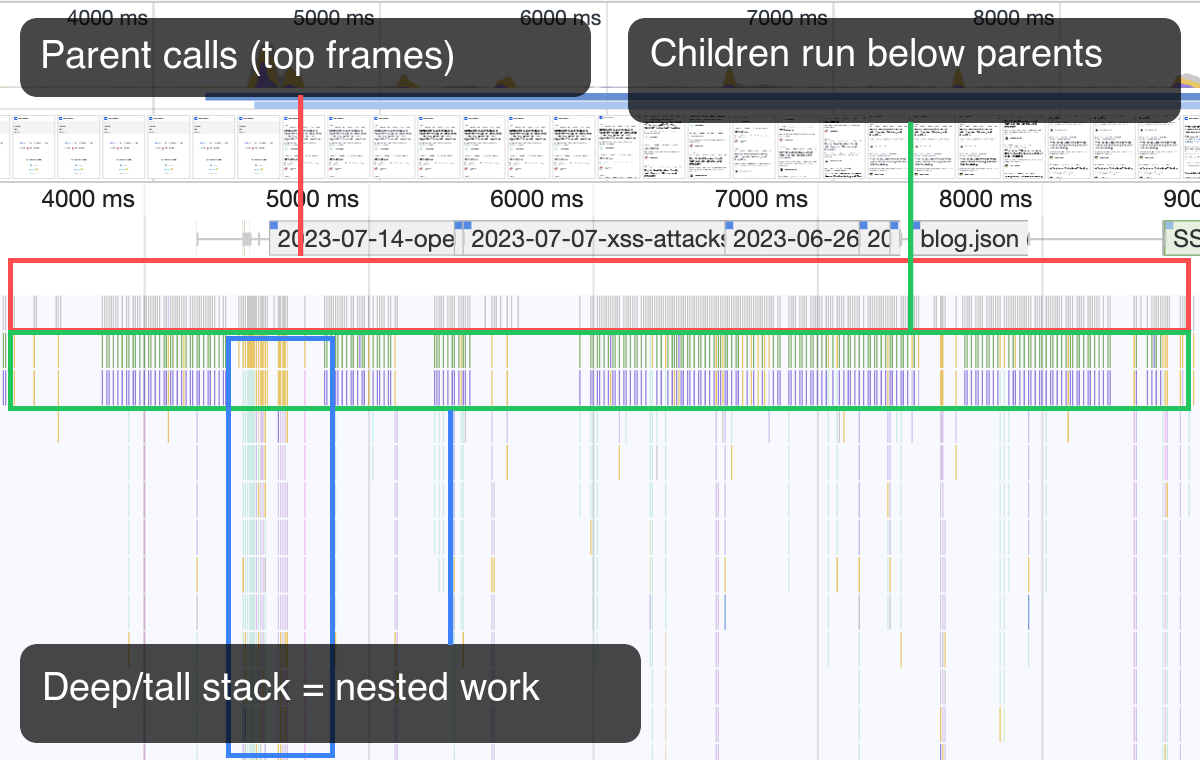
Practical interpretation:
- A deep stack often means nested work (wrappers, utilities, framework internals, handlers).
- A wide block near the top often indicates a long task that can block responsiveness.
- If the parent is wide but self time is low, optimize the heavy child first.
How to Spot Expensive Functions Quickly
Use this workflow on every performance trace:
- Find long tasks first (tasks over ~50ms; Chrome highlights these).
- Zoom into a suspicious range and click the widest frames.
- Check Self Time and Total Time in Summary.
- Use Bottom-Up to find true hotspots across the recording.
- Use Call Tree to verify call path and parent relationship.
- Re-record after optimization and compare.
This prevents premature optimization and keeps the effort focused on real bottlenecks.
Before/After Optimization Example
Let's take a common case: filtering and rendering a large list while typing in a search field.
Before (expensive on every keypress):
function renderResults(products, query) {
  const root = document.getElementById('results')
  root.innerHTML = ''

  products
    .filter((p) => p.name.toLowerCase().includes(query.toLowerCase()))
    .sort((a, b) => a.price - b.price)
    .forEach((product) => {
      const row = document.createElement('div')
      row.textContent = `${product.name} - ${new Intl.NumberFormat('en-US').format(product.price)}`
      root.appendChild(row)

      // Repeated read+write layout work inside loop
      const height = root.offsetHeight
      root.style.minHeight = `${height}px`
    })
}
After (debounced + batched DOM updates + no layout thrashing):
const usdFormatter = new Intl.NumberFormat('en-US')

function debounce(fn, wait) {
  let timeout
  return (...args) => {
    clearTimeout(timeout)
    timeout = setTimeout(() => fn(...args), wait)
  }
}

const renderResults = debounce((products, query) => {
  const root = document.getElementById('results')
  const fragment = document.createDocumentFragment()

  const filtered = products
    .filter((p) => p.name.toLowerCase().includes(query.toLowerCase()))
    .sort((a, b) => a.price - b.price)

  for (const product of filtered) {
    const row = document.createElement('div')
    row.textContent = `${product.name} - ${usdFormatter.format(product.price)}`
    fragment.appendChild(row)
  }

  root.replaceChildren(fragment)
}, 120)
Illustrative comparison from the flame chart (numbers are representative, not measured):
| Metric | Before | After |
|---|---|---|
renderResults total time | 118ms | 22ms |
renderResults self time | 67ms | 9ms |
Long tasks (>50ms) while typing | 3 | 0 |
| Typing responsiveness | Noticeable lag | Smooth |
In flame chart terms:
- Before: wide parent frame + deeper child stack during each keypress.
- After: narrower frames, fewer long tasks, and much smaller scripting blocks.
Common Mistakes While Reading Flame Charts
- Optimizing purely by color instead of time.
- Looking only at one frame and ignoring Bottom-Up view.
- Confusing parent total time with parent self time.
- Recording once and concluding too early.
Always take multiple recordings, optimize one bottleneck at a time, and compare traces.
Conclusion
The flame chart is one of the fastest ways to reason about runtime performance when we read it correctly. Once we understand width, depth, and parent-child relationships, we can identify expensive functions quickly and optimize with confidence.
Part one helped us capture and navigate the profile. Part two gives us a method to interpret it and act on it.