Profile Ruby 2.0 apps using DTrace - Part 1
by Hemant,
This is a series of blog posts we are going to do in tutorial format, this is Part 1 of our tutorial on Dtrace.
DTrace is awesome. If your operating system supports it, using DTrace can give incredible insight into processes that are running on your system. If you are still not convinced about its usefullness you should checkout - How Dtrace helped twitter identify bottlenecks, Profiling Rails startup with Dtrace.
So what exactly is DTrace? According to Wikipedia - "DTrace is a dynamic tracing framework that allows users to tune and troubleshoot applications and the OS itself." It is available on Solaris, Mac OSX, FreeBSD and recent versions of Oracle Linux. If you are running any of the above operating systems, there is nothing to install - just hop in.
Dtrace allows you to instrument a live process by defining trace points called probes, which can be turned on or off dynamically. The probes fire when a particular condition is met and it requires no change in application code, no special flags and there is very little penalty of running a production app with probes turned on.
What is a probe?
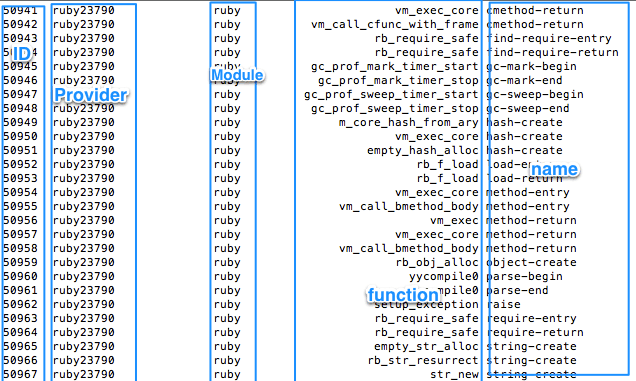
At its core a probe is like a light bulb that switches on when a condition is met. The condition could be entering a C function defined within a module, exiting a C function, entering a system call provided by Kernel etc. A probe is made of 5 parts,
- ID - Internal ID of the probe.
- Provider - Name of the provider.
- Module - The name of the UNIX module or Application.
- Function - The name of function in which probe exists.
- Name - Name of the probe (as chosen by author of probe).
All the processes currently running on operating system (including the kernel itself) have some probes defined. As an example, lets try and list all the probes defined by Ruby 2.0
~> sudo dtrace -l | grep ruby

Running Dtrace
Dtrace probes can be set and run via the command line itself or can be run via Dtrace scripts written in a programming language called D.
Some simple command line examples:
~> sudo dtrace -f write
Above probe will start firing each time any application makes write system call.
Dtrace scripting capabilities
The real power of Dtrace lies in ability to script - tracing of running applications, gathering results and then printing or plotting them.
A DTrace script is essentially made of 3 parts:
probe description
/predicate/
{
    action;
}
D language has some similarity with C but at its core it is a scripting language, probably closer to awk etc.
For example, lets write a D script for printing all system calls being made by currently running applications.
~> cat > dtrace_scripts/syscall.d
syscall:::entry
{
  printf("%s(%d) called %s\n", execname, pid, probefunc)
}
Above script when ran via sudo dtrace -qs syscall.d will start printing name,pid of processes that are making system calls and what system calls they are making. The script does not have
predicate, but only probe description.
Probe description
A probe description can be written as:
provider:module:function:probename
Few simple examples:
# A probe that will fire each time a system call called write is entered
syscall::write:entry
# This probe will fire each time someone creates a new ruby array
ruby*::ary_new::
As you can see, you can skip parts of the probe and can use wildcards such as * or ?.
That about sums up content for part 1 of DTrace tutorial. In the next part we are going to cover predicates, aggregates and we will do profiling of real Ruby applications.I will recommend you to play with various probes and stay tuned for Part 2 which is coming up very soon. You should also follow us on twitter @codemancershq if you don't want to miss out Part 2.