DIY Ruby CPU profiling - Part IV
by Emil Soman,
In Part I we saw how CPU profilers work, in Part II we learned how to measure execution time of programs using CPU time and Wall time and in Part III we learned how to use Ruby's TracePoint API to trace method calls and returns in Ruby VM. We also started building our DiyProf gem. It's recommended to read those first before you continue. In this part we're going to create a simple call graph visualization using the data we collected using the TracePoint API.
Part IV. Call Graphs
In Part III, we used Ruby's TracePoint API to print method call and return traces. It'd be more useful if we can parse these traces and create a call graph out of it. A call graph is basically a visual representation of the method calls, in the form of a tree. It looks like this :
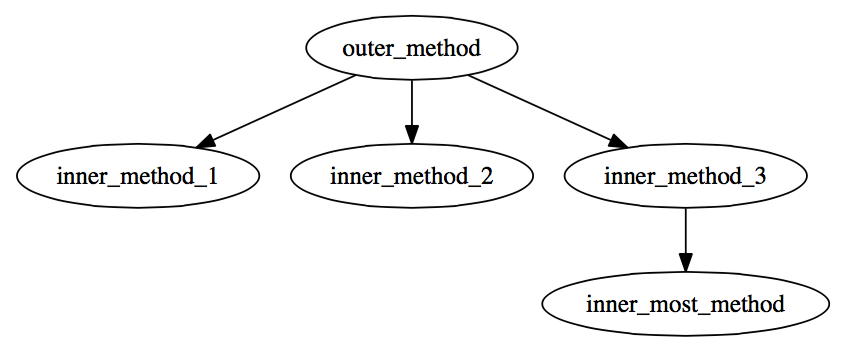
This graph tells us that outer_method calls 3 methods from inside it:
inner_method{1,2,3} and inner_method_3 calls another method named
inner_most_method.
Graphviz and the DOT language
Graphviz is a graph visualization tool which can take a graph description in text format and generate diagrams as PDF and other formats. For describing graphs in text format, Graphviz uses a language called DOT, which is a simple declarative way of describing nodes and connections between them.
Before proceeding, make sure you've installed graphviz and the dot command
is available in your $PATH.
Follow their official documentation for
installation steps.
Now let's take an example.
digraph graph_name {
  a -> b -> c;
  b -> d;
}
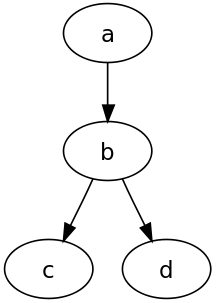
Save the above lines as sample.dot and run the following command:
dot -Tpdf sample.dot -o graph.pdfThe above command will generate a directed graph that looks like this:
There's another way to represent graphs, by separating nodes and connections like so:
digraph graph_name {
  <nodes>
  <connections>
}
So the following DOT notation represents the same graph:
digraph graph_name {
  a;
  b;
  c;
  d;
  a -> b;
  b -> c;
  b -> d;
}
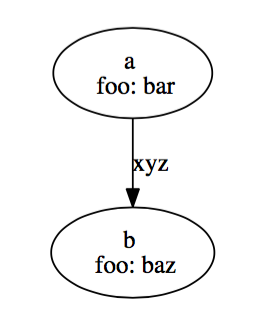
It's also possible to add additional labels to nodes and connections.
digraph graph_name {
  a [label="a \n foo: bar"];
  b [label="b \n foo: baz"]
  a -> b [label="xyz"];
}
Above DOT code represents the following graph:
Call Graph with Graphviz
We're going to create a reporter class for our DiyProf gem which will keep collecting all method calls and create a DOT file that represents the call graph.
We'll add a record method under the DotReporter class which pushes method infos into a stack
when calls happen and pop them out of the stack when the methods return.
When the method info is popped from the stack, the time it spent in the stack
is recorded(which is the execution time) and it adds the method's call info(method name and time)
to a call tree. See the code below:
module DiyProf
  # Struct that will hold a method name and a timestamp
  CallInfo = Struct.new(:name, :time)

  class DotReporter
    def initialize
      # A stack for pushing/popping methods when methods get called/returned
      @call_stack = []
      # Nodes for all methods
      @methods = {}
      # Connections between the nodes
      @calls = {}
    end

    def record(event, method_name, time)
      case event
      when :call
        @call_stack << CallInfo.new(method_name, time)
      when :return
        # Return cannot be the first event in the call stack
        return if @call_stack.empty?

        method = @call_stack.pop
        # Set execution time of method in call info
        method.time = time - method.time
        add_method_to_call_tree(method)
      end
    end
  end
end
add_method_to_call_tree adds nodes and connections for the added method.
Here's the code that does that:
# Struct that holds the time spent in a method
# and the total number of times a method was called
MethodInfo = Struct.new(:count, :total_time, :self_time)

def add_method_to_call_tree(method)
  # Add method as a node to the call graph
  @methods[method.name] ||= MethodInfo.new(0, 0, 0)
  # Update total time(spent inside the method and methods called inside this method)
  @methods[method.name].total_time += method.time
  # Update self time(spent inside the method and not methods called inside this method)
  # This will be subtracted when children are added to the graph
  @methods[method.name].self_time += method.time
  # Update total no of times the method was called
  @methods[method.name].count += 1

  # If the method has a parent in the call stack
  # Add a connection from the parent node to this method
  if parent = @call_stack.last
    @calls[parent.name] ||= {}
    @calls[parent.name][method.name] ||= 0
    @calls[parent.name][method.name] += 1

    # Take away self time of parent
    @methods[parent.name] ||= MethodInfo.new(0, 0, 0)
    @methods[parent.name].self_time -= method.time
  end
end
Now that we have the nodes and connections in @methods and @calls,
it'll be trivial to generate a DOT file that looks like this:
digraph G {
  <graph_nodes>
  <graph_links>
}
Here's the code that will walk through @methods and @calls and prepare
such a DOT file:
def dot_notation
  dot = %Q(
    digraph G {
      #{graph_nodes}
      #{graph_links}
    }
  )
end

def graph_nodes
  nodes = ""
  @methods.each do |name, method_info|
    nodes << "#{name} [label=\"#{name}\\ncalls: #{method_info.count}\\ntotal time: #{method_info.total_time}\\nself time: #{method_info.self_time}\"];\n"
  end
  nodes
end

def graph_links
  links = ""
  @calls.each do |parent, children|
    children.each do |child, count|
      links << "#{parent} -> #{child} [label=\" #{count}\"];\n"
    end
  end
  links
end
Check out the lib/diy_prof/dot_reporter.rb file on the github repo
to see how all of this will fit together. We also need some changes in the
Tracer class we wrote in Part III to make use of a custom reporter class:
module DiyProf
class Tracer
# We'll need to initialize the Tracer with DotReporter.new
def initialize(reporter)
@reporter = reporter
@tracepoints = [:call, :return].collect do |event|
TracePoint.new(event) do |trace|
# Use the reporter instead of just printing the traces
reporter.record(event, trace.method_id, cpu_time)
end
end
end
...
# New method added to collect the report after profiling
def result
@reporter.result
end
end
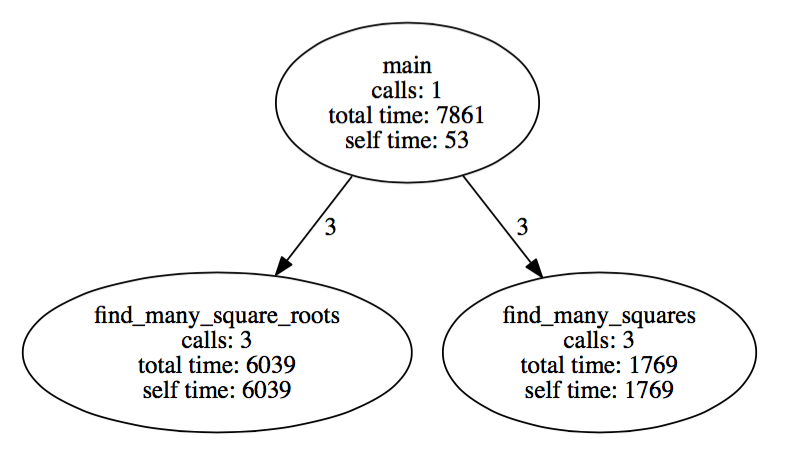
endNow that our tracer is able to generate a DOT formatted report, we can use it on our sample program we wrote in the previous parts:
def main
  3.times do
    find_many_square_roots
    find_many_squares
  end
end

def find_many_square_roots
  5000.times{|i| Math.sqrt(i)}
end

def find_many_squares
  5000.times{|i| i**2 }
end

DiyProf.start_profiling
main
result = DiyProf.stop_profiling

require 'tempfile'
f = Tempfile.open('dot')
f.write result
f.close
system("dot -Tpdf #{f.path} -o call_graph.pdf")
We should get a call graph that looks like this:
Congratulations if you got this far! Check out the github repo which has the complete code if you got stuck somewhere.
Bonus!
Wouldn't it be cool if we could vary the size of the nodes based on self or total
time of the method?
The DOT syntax accepts a bunch of attributes for nodes and edges.
Looks like we can use size and fontsize attributes to vary the size of the
nodes and the text inside the nodes. I'll leave it to you to think of how to use
these to make the most expensive methods stand out in the call graph.
Recap
We've learned about Graphviz and the DOT language and how to use them to create call graph diagrams out of the data collected by Ruby Tracepoint API. In Part V, we'll start building a sampling profiler for Ruby, in particular we'll learn some basics about interrupts and signal handling in C. Thanks for reading! If you would like to get updates about subsequent blog posts in this DIY CPU profiler series, do follows us on twitter @codemancershq.